
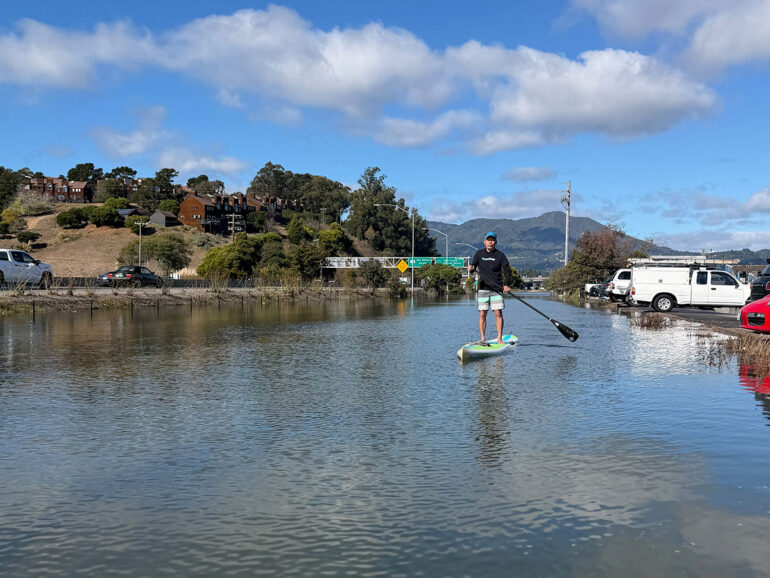
The first winter I moved to a houseboat in Sausalito, a series of January king tides put our parking lot under two feet of salt water. Our neighbors — who had just bought a brand-new Prius — went out of town and left their car behind. It flooded completely, and the insurance company declared it a total loss.
For a newcomer, the experience was both wild and surreal. A friend and I launched a double kayak from Mike’s Bikes, paddled along the flooded bike path and took the Highway 1 exit all the way to the Manzanita intersection. A CHP officer standing in waist-deep water directed traffic; he took one look at us, smiled and waved us through. Later that night, my friend called: “Turn on the news! We’re on TV!”
Over the two decades I’ve lived on the water, I’ve developed a classic love-hate relationship with tidal flooding. When you’re prepared, it’s thrilling. Flooding fundamentally transforms the landscape — roads vanish, and you trade your steering wheel for a paddle.
On the other hand, it can be an absolute nightmare.
You return home late at night, exhausted, and check the tide chart as you park, praying it isn’t one of those days the forecast got it wrong. On November 5, 2025, I assured a neighbor on the dock that the tide chart predicted a 6.7-foot tide, well below our parking lot’s flood point. “We’ve got 5 inches to spare,” I told her.
Instead, the tide crested at 7.5 feet — nearly 9 inches higher than the forecast. Salt water crept right up to our doorframes.
From Backyard Lab to Local Forecasts
My backyard isn’t just a scenic view; it’s my living laboratory. I still remember my early mornings on the houseboat, eating a bowl of cereal on Sunday while watching the mudflats. By the time I finished the bowl, the rising tide would already be covering the mud.
In my day job as a software engineer, I analyze complex data systems across various industries. Eventually, I had to ask myself: Could I build a machine learning model that forecasts local tidal flooding better than traditional tide charts?
I knew it was possible because I had access to real-time data NOAA scientists didn’t have when creating static charts 20 years ago — namely, live oceanographic and atmospheric feeds. After that disastrous November 2025 tide, I decided to go for it. When the January king tides rolled around, I tested my new predictive model and shared the remarkably accurate results with neighbors via Nextdoor posts. That early success laid the groundwork for my WET app (Weather, Event, Tide), which officially launched in May 2026.
The Hidden Cost of Salt Water
Salt water inflicts severe damage long before it ever enters a car’s cabin or a ground-floor home. During a recent king tide, my car was parked on the higher side of the lot with inches to spare. Yet, the sloshing wake from passing vehicles soaked the starter motor mounted low in the engine bay, causing $1,500 in damage. A neighbor on West Pier suffered the same fate with his BMW a week later.
When salt water intrusion occurs, the symptoms aren’t always immediate; it can take days or weeks for corrosion to set in. In my case, I got into my car a week later and noticed a slight delay when turning the key. Day by day, the ignition grew weaker until, eventually: total silence.
The New Normal
For decades, we’ve all relied on astronomical tide tables calculated by the National Oceanic and Atmospheric Administration (NOAA) years in advance. These tables account for the predictable gravitational pull of the moon and sun. What they can’t predict decades ahead are real-time local variables: atmospheric pressure, shifting winds, ocean swells and heavy rainfall, which can easily add a foot or two of water. In low-lying Marin, that unexpected foot is the difference between tiptoeing to your driver’s side and calling your insurance adjuster.
During El Niño events, standard tide charts become wildly unreliable. Long ocean features known as Kelvin waves travel up the Pacific coast from Mexico, pushing huge masses of warm water northward. A passing Kelvin wave can add roughly 1.3 feet of surge to local bay waters on its own — and when combined with recent sea level rise, local tides can end up over a foot and a half higher than published tables predicted. In Marin’s basin-like topography, an extra inch above a sea wall or barrier can quickly turn into a foot of standing water on residential streets.
How Does it Work?
Predicting absolute water levels at NOAA’s Golden Gate Tide Station is only the first piece of the puzzle. Water takes time to travel into the northern reaches of San Francisco Bay, amplifying or dampening depending on local geography.
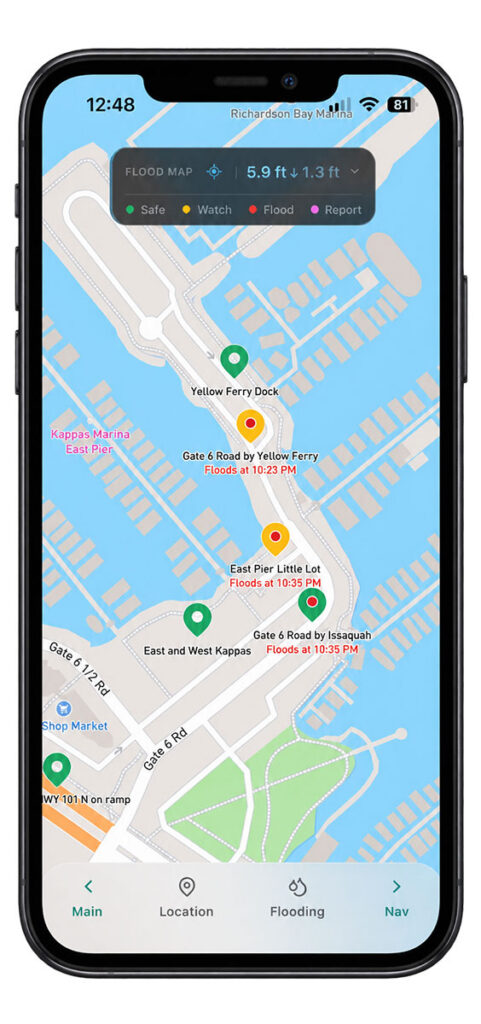
Every neighborhood behaves differently.
For example:
Gate 6 ½ Road in Sausalito: The elevation is a straightforward incline from the bay edge. Here, flooding is linear — one extra inch of tide means one extra inch of flood depth in the parking lot.
Hwy 101 Northbound (Stinson Beach Exit): Water slowly trickles in around 6.4 feet. But once the tide hits 7.1 feet, it breaches the elevated bike path holding it back, completely inundating the exit off-ramp in under 30 minutes.
To predict exact flood times and depths 12 hours in advance, a model must account for basin size, inflow geometry and existing drainage infrastructure. After extensive testing, WET successfully modeled these complex fill-and-drain mechanics across varied shorelines.
To help residents protect both their vehicles and their homes, WET has a “Personal Tide Watch” feature. Users can set up custom threshold alerts across multiple locations to monitor property risks in real time — whether that’s tracking your neighborhood parking lot, keeping tabs on a low-lying dock, or receiving an early warning before water threatens a driveway or garage.
To address larger ocean phenomena like kelvin waves, we also introduced “Surge Trend” — a visual tool tracking surges across coastal tide stations from San Diego to San Francisco. By viewing data over weeks rather than hours, users can clearly watch regional surge trends move north along the coast long before they spill over Marin’s shorelines.
Protecting the Bay We Love
While flood warnings grab headlines, living on the bay is about much more than staying dry. Over the years, I’ve kayaked Corte Madera Creek and paddled Richardson Bay through every season. I’ve seen thousands of herring turn the water silver around our dock pilings, witnessed flock “fish drives” of pelicans, cormorants and egrets working together in shallow water, and navigated through thick spring meadows of native eelgrass.
Eelgrass is vital to the health of the bay. It filters water, creates nursery habitat for marine life, and helps buffer shorelines against wave action and erosion. To help local boaters and kayakers navigate responsibly, WET incorporates interactive navigation layers with mapped eelgrass meadows. Paddlers can check water depth relative to their boat’s draft, avoiding damage to fragile marine habitats during low tides.
Living right on the water also highlights how hyper-local Marin’s microclimates can be. Standard weather apps often struggle with coastal marine layers. To make temperature forecasts more transparent, WET provides realistic high/low prediction ranges during uncertain weather conditions, giving residents a clearer picture of what to expect.
A Community-Driven Future
I feel that WET is bigger than any one of us — just like the bay we live by. That’s why it belongs to all of us as a community-driven project.
My vision is for WET to remain a free, accessible resource for everyone in Marin, sustained by individual donations and small banner sponsorships from local businesses rather than paywalls or intrusive ads. Residents can also actively contribute real-time flood reports and photos, helping to crowdsource and fine-tune the model’s accuracy for every neighborhood over time.
By combining modern technology with a deep love for our unique coastal environment, we can transform how we live alongside the bay — staying safe, protecting our ecosystem, and safeguarding our homes and cars when the next king tide rolls in.